Open Source Chrome MV3 TypeScript August 27, 2026 11 min read

Every tool says the page is slow.
None of them say which function.

My day job is performance and reliability engineering, so I spend a lot of time looking at slow pages. The tools I reach for are good at telling me a page is slow and bad at telling me what to change. Perflex is my attempt at the missing half. It watches a page while you use it, works out which script and which function held the main thread, and writes the fix down next to the problem. It runs in the browser, and nothing is uploaded.

Available on Chrome Web Store Chrome · Edge · Brave · Arc
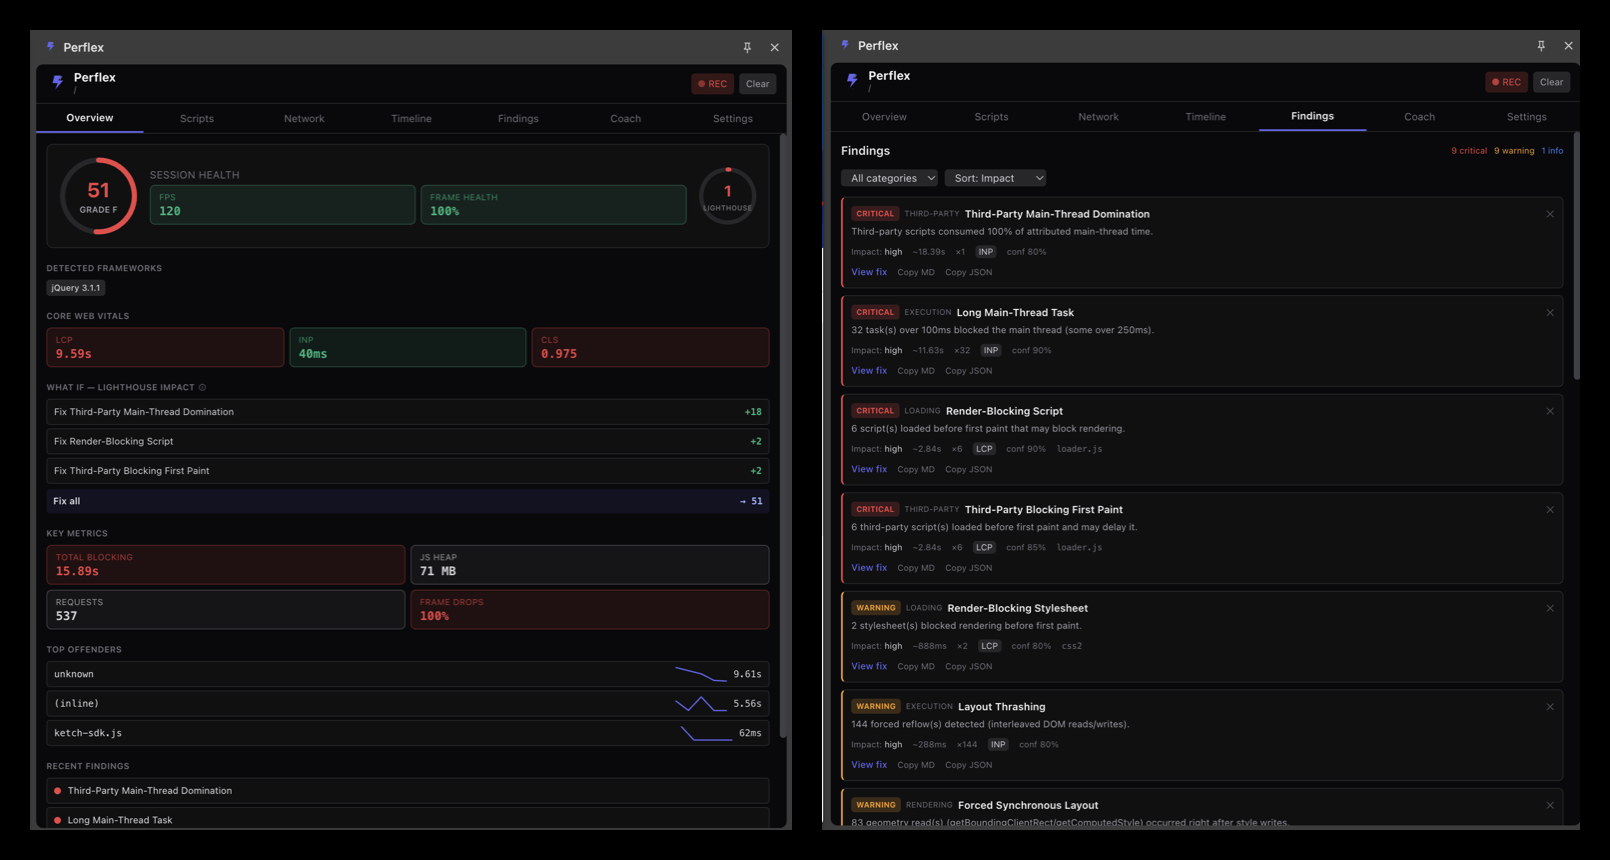
Two Perflex panels side by side: the Overview showing a health score of 51 and grade F, and the Findings list with nine critical problems

Fig. 00The same session in two tabs: the score with Core Web Vitals on the left, and the ranked list of things to fix on the right.

Detectors 37 Ways a page goes slow that it checks for
Uploaded 0 bytes No account, no telemetry, no server
Overhead ceiling <2 % Past this it throttles itself
Ways out 6 JSON · HAR · OTLP · PDF · HTML · permalink
Why I built it

Where the tools I use stop.

Lighthouse hands me a score from a lab run on a machine that isn't mine. The Performance panel in DevTools hands me a flame chart, and with an hour to spare I can usually find the answer inside it. RUM tells me the p75 moved last Tuesday. All three are worth having. None of them has ever told me the name of the function I need to open.

01

It names the function

Chrome's Long Animation Frames API reports which script blocked a frame and roughly where. Perflex adds those up per function, so a long task stops being an anonymous block of scripting and starts having a name and a line.

02

It writes down the fix

Everything it finds comes with the before and after code, how risky the change is, and what to check once you have made it. I got tired of advice that stops at "consider deferring this".

03

It stays on your machine

Collecting the events, working out the numbers and checking them all happen inside the tab. There is no account and no telemetry, and nothing is uploaded, because there is no server on my end to upload it to.

What it does

Seven tabs, one session.

Open the side panel and use your site the way somebody actually would. Perflex builds the picture behind you and sorts it by what is costing you the most.

Overview

The first screen.

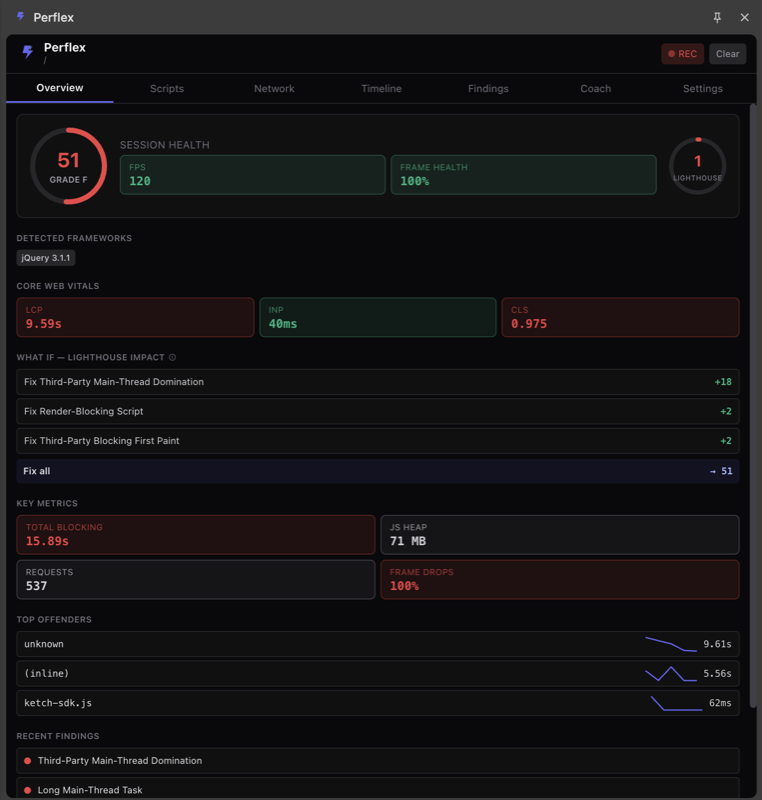
A score out of 100 with a letter grade, your Core Web Vitals as they happen, and an estimate of what Lighthouse would give you, worked out locally without running Lighthouse.

  • LCP, INP and CLS as they happen, along with blocking time, frame rate, heap and dropped frames
  • A "what if" list that sorts each problem by how many Lighthouse points fixing it would give back
  • The worst offenders, each with a small trend line, and whatever framework it found on the page
Perflex Overview tab showing a session health score of 51 (grade F), FPS and frame health, Core Web Vitals with LCP 9.59s, INP 40ms and CLS 0.975, a What-If Lighthouse impact list, key metrics and top offenders

Fig. 01A news site I profiled: 15.89 seconds of blocking time across 537 requests. It reckons the third-party scripts on their own are worth 18 points.

Scripts

Which script, then which function.

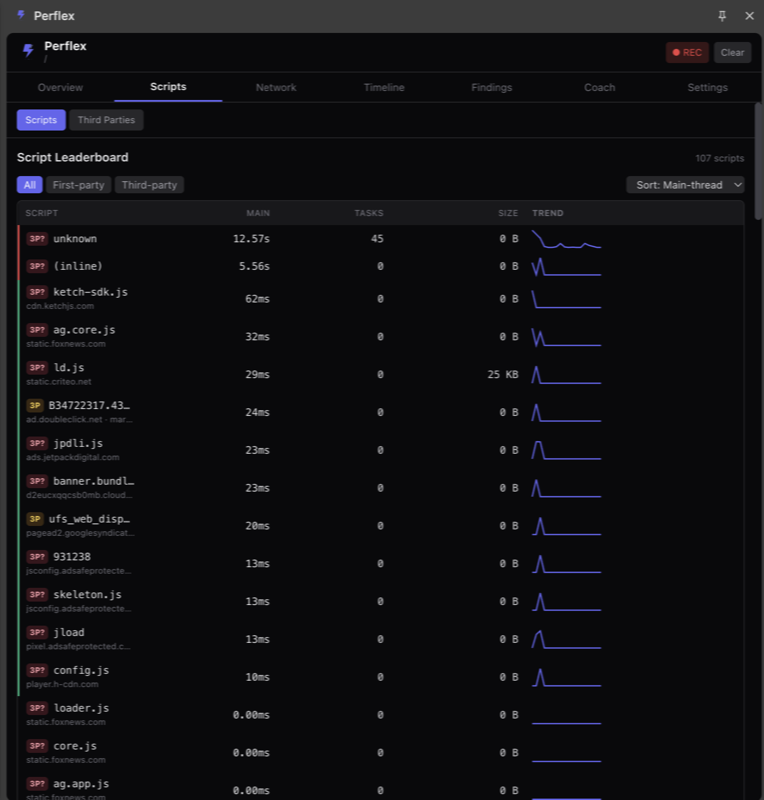
Every script on the page sorted by how long it held the main thread, along with its long tasks, transfer size, share of layout shift and memory growth. Open a row and you get the functions inside it that cost the most, with their source positions.

  • A first-party and third-party filter, so you can separate code you wrote from code you bought
  • A Third Parties view that groups scripts by vendor, so Google Analytics or Stripe shows up as one line rather than nine
  • A button that removes a vendor and works the score out again, which is the number you need when someone asks whether the tag is worth keeping
Perflex Scripts tab showing a script leaderboard of 107 scripts sorted by main-thread time, with columns for main-thread cost, long tasks, transfer size and a sparkline trend

Fig. 02107 scripts on one page, and 12.57 seconds at the top of the list. The coloured bar down the left marks first-party against third-party.

Findings

The list of things to fix.

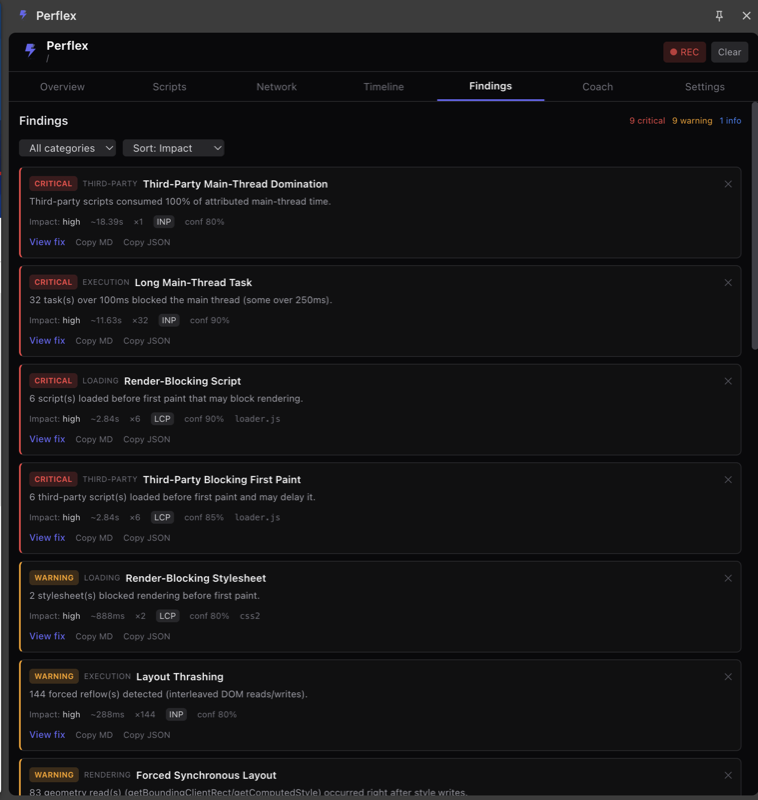
Perflex knows 37 ways a page goes slow, across loading, running, rendering, network, third parties and frameworks. Layout thrashing, scripts that block rendering, synchronous XHR, the same fetch twice, payloads sent uncompressed, lists rendered without a limit, timers firing far more often than anyone intended. It checks your session against all of them.

  • Each one says how bad it is, how often it happened, how sure it is, and which vital it hurts
  • It knows the frameworks, so it will tell you when a React development build has gone to production, or when two UI frameworks are loading on one page
  • Copy MD and Copy JSON put the whole thing into a ticket without you retyping it
Perflex Findings tab listing critical and warning findings including Third-Party Main-Thread Domination, Long Main-Thread Task, Render-Blocking Script, Render-Blocking Stylesheet, Layout Thrashing and Forced Synchronous Layout, each with impact, confidence and a View fix link

Fig. 03Nineteen problems, worst first. Layout thrashing with 144 forced reflows is the sort of thing a score out of 100 will never name.

Timeline

What led to what.

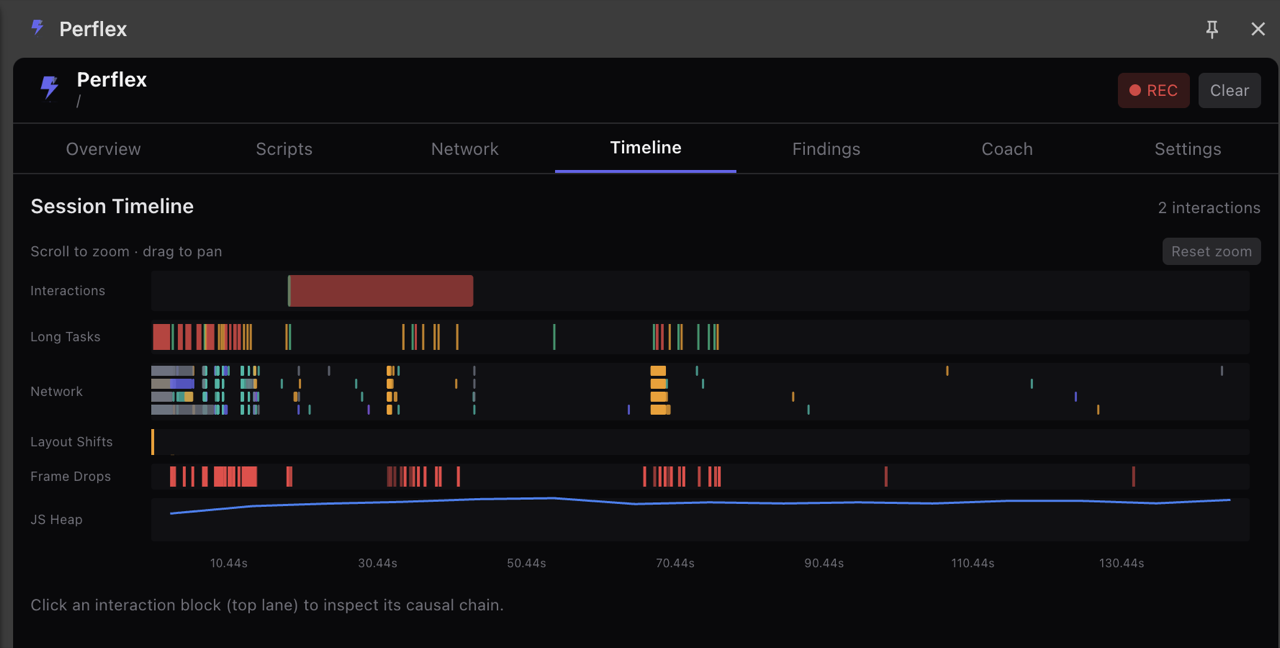
A timeline drawn with D3 that you can zoom into and drag around, with a lane each for interactions, long tasks, network, layout shifts, dropped frames and the heap.

Click an interaction and it walks back through what caused it: the click that started the long task that fired the fetch that changed the DOM that forced a reflow that moved the layout. Breaking that chain anywhere is usually cheaper than making any one link faster.

Perflex Session Timeline showing six stacked lanes — Interactions, Long Tasks, Network, Layout Shifts, Frame Drops and JS Heap — across a 130 second session, with a scale in seconds along the bottom

Fig. 04Six lanes against the same clock. The red marks in Frame Drops sit directly under the long-task clusters, which is usually the first thing worth noticing.

Network

Requests, phase by phase.

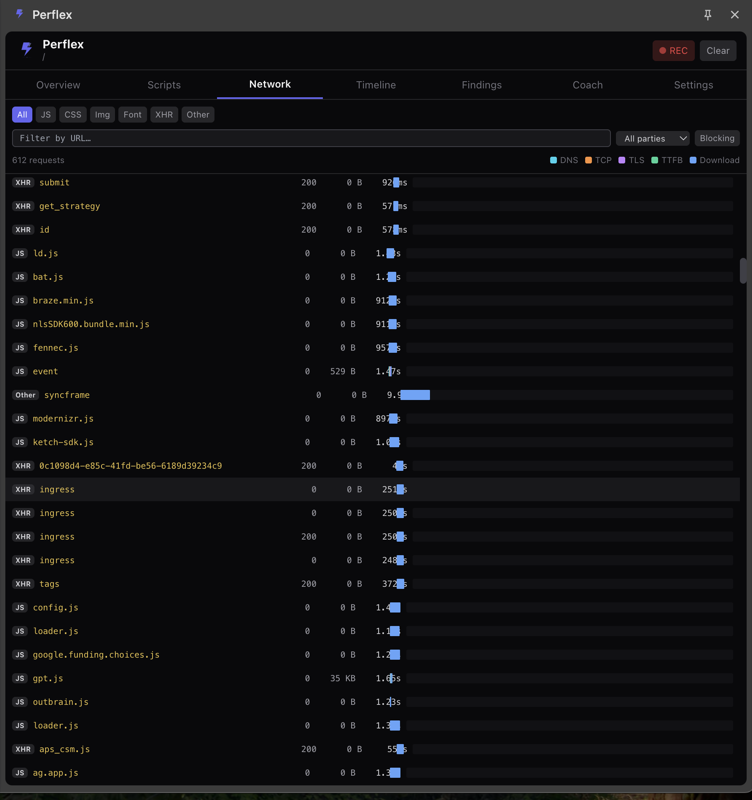
A waterfall of its own, drawn with virtual scrolling so it stays usable past 500 requests. Each bar is split into DNS, TCP, TLS, waiting and download, so you can see where in a request the time went rather than only how long the whole thing took.

  • Marks for requests that block rendering, and for the ones served from cache or a service worker
  • Filters by type, by URL, and by first or third party
  • A blocking-only toggle for when you only care about what is holding up first paint
Perflex Network tab showing a virtualized waterfall of 612 requests with type filters, a URL filter, a party filter and a blocking toggle, and a legend for DNS, TCP, TLS, TTFB and Download timing phases

Fig. 05612 requests on one page load. The colours are the point: a slow request and a request that waited a long time to start need completely different fixes.

Coach

Asking it questions.

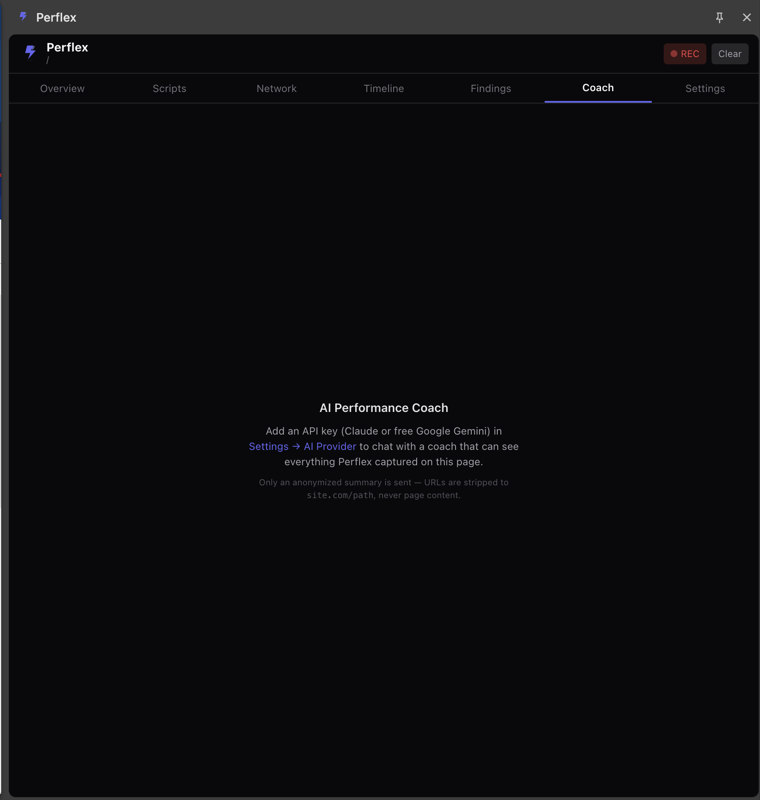
A chat tab that can see everything Perflex captured on the page. You can ask why the page is slow, or what to fix first, and get an answer that refers to your actual numbers instead of general advice.

It needs an API key, either Claude or Google Gemini, whose free tier is enough. It does nothing until you add one. What gets sent is a summary with the identifying parts taken out: file names, function names and numbers. URLs are cut back to the site and the path, and page content and request bodies never go anywhere.

Perflex Coach tab empty state reading AI Performance Coach — add an API key (Claude or free Google Gemini) in Settings, with a note that only an anonymized summary is sent and URLs are stripped to site.com/path, never page content

Fig. 06The empty state says what leaves your machine before you have typed anything, which felt like the right place to put it.

Sharing and export

Getting the session out.

A session is not much use if it dies in your tab. Perflex writes out JSON, HAR with its own extra fields, OpenTelemetry traces you can open in Jaeger or Tempo, and a PDF with the gauges, the vitals, a small waterfall and the code.

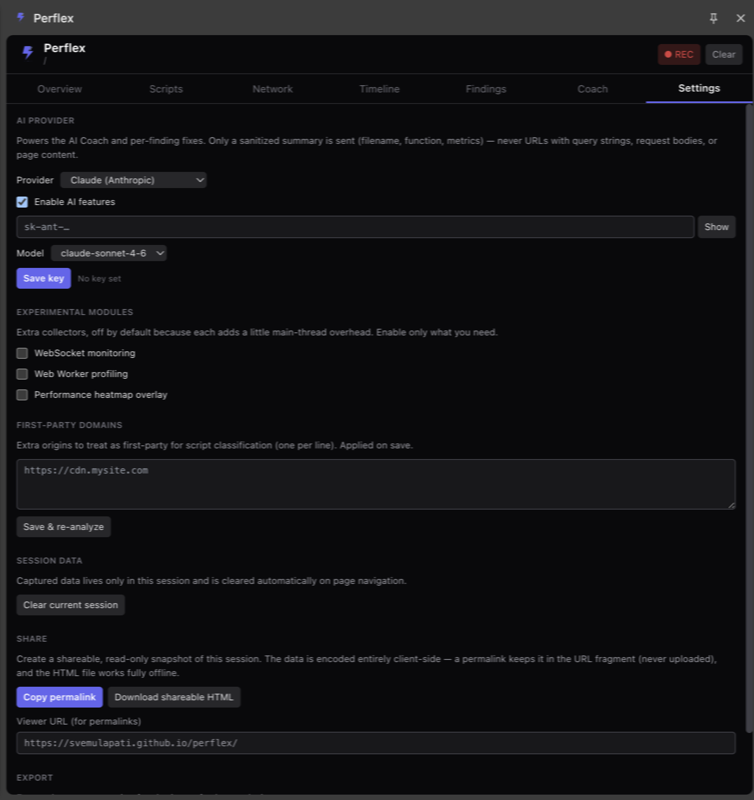
Sharing works the same way as the rest of it. A permalink compresses the whole session into the part of the URL after the hash, which browsers never send to a server, and the person you send it to decodes it locally. Or you can download one HTML file with the session inside it, which opens offline with no extension and no server, and is the one to attach to a ticket.

Perflex Settings tab showing AI provider selection with Claude and a model dropdown, experimental collector modules, first-party domain configuration, session data controls, and a Share section with Copy permalink and Download shareable HTML buttons

Fig. 07The experimental collectors are off when you install it, because each one costs a little main thread and most sessions do not need them.

How it works

How it is put together.

Six pieces, arranged so the expensive work never runs on the page's main thread. The collector sits in the page itself with a buffer that never grows, and hashes stack traces rather than keeping them as strings, because building strings in a hot loop is one of the things it is there to catch. Everything after that runs in a worker.

Perflex architecture The collector runs in the page's MAIN world and posts messages to a bridge content script in the ISOLATED world, which relays over chrome.runtime to a per-tab service worker, which streams over a Port to the React side panel where the correlator and analyzer run in web workers. Page — main world Extension — privileged Collector (IIFE) PerformanceObserver — LoAF, LCP, CLS fetch / XHR hooks timers, forced reflow, thrashing ring buffer + FNV-1a fingerprints self-monitoring circuit breaker Injected via chrome.scripting — CSP-proof postMessage Bridge — content script ISOLATED world · relays onward chrome.runtime Service worker per-tab buffer · re-injects Port Side panel (React 18 + Zustand) Correlator (Web Worker) fuses events into profiles Analyzer (Web Worker) 37 matchers + Lighthouse estimate Overview · Scripts · Network · Timeline · Findings · Coach Export → JSON · HAR · OTLP · PDF · interactive HTML · permalink
01

Collector

Sits in the page and records long tasks, network, timers, forced reflows, layout shifts and memory into a buffer with a fixed size. Stacks are hashed with FNV-1a instead of being kept as strings.

02

Bridge & service worker

A content script passes events over chrome.runtime to a per-tab buffer in the service worker. webNavigation tells it when you have gone to a new page, so the collector goes back in and the session starts clean.

03

Correlator (Web Worker)

Turns the raw stream of events into per-script and per-function numbers, Core Web Vitals and interactions. This is the step that turns "a long task happened" into "this function, in this file, cost this much".

04

Analyzer (Web Worker)

Runs the 37 checks and works out the Lighthouse estimate. Both sit in a worker, so the analysis never shows up in the thing being analysed.

05

Remediation & Coach

A written fix for every pattern, with before and after code, a risk level and what to check afterwards, plus the optional Claude or Gemini path for questions about your own session.

06

Reporter & export

The React panel, the overlay you can drop onto any page with Ctrl+Shift+X, and the six ways of getting a session out.

What it costs the page

It measures itself too.

A tool that costs performance to measure performance is not much use, so Perflex keeps an eye on its own overhead against the frame budget and throttles collection if it goes past 2%. You can watch that happen in the overlay, which shows the frame rate, the heap, long tasks and whether it is currently throttling, on any page you like.

# build it yourself git clone https://github.com/svemulapati/perflex.git cd perflex && npm install npm run build → produces dist/ # chrome://extensions → Developer mode # → Load unpacked → select dist/ Ctrl+Shift+P open the side panel Ctrl+Shift+X toggle the in-page overlay
Compared to what I already had

It does not replace your monitoring.

Perflex is not trying to take over production monitoring, and it would be bad at it. It is for the part of the job where you already know the page is slow and need to work out which line to change.

Perflex Lighthouse DevTools Perf Sentry / Datadog RUM
Runs on the real page, liveYesLab runYesYes
Names the functionYesNoManualNo
Checks for known problems37SubsetNoSubset
Gives you the code to changeYesGenericNoNo
Answers questions about your sessionYesNoNoPaid
Shows what caused whatYesNoManualPartial
Free & open sourceMITYesYesNo
Runs entirely on your machineYesYesYesNo
Exports HAR, OTLP and PDFAll threeJSONPartialYes
Why it works this way

Four decisions worth explaining.

01

A score on its own does not help

Knowing the LCP is 9.59 seconds tells you something is wrong. It does not tell you which of the 107 scripts on the page held the thread for twelve and a half seconds, and until you know that, every fix is a guess that costs a deploy to test.

02

Most of the cost is not yours

On a lot of sites the scripts eating the main thread are ones nobody on the team wrote. You cannot fix code you do not own, but you can measure exactly what it costs and take that number to whoever signed off on the tag.

03

A fix nobody dares ship is not a fix

Performance advice that might break a checkout does not get merged. That is why every fix comes with a risk level, the steps to check it afterwards, and a note on why it leaves the behaviour alone.

04

Profiling data is production data

URLs carry tokens and request bodies carry personal data. That is why nothing leaves the browser on its own, why permalinks live in the part of the URL that is never sent, and why the AI features do nothing until you turn them on.

FAQ

Questions I have been asked.

01

How is this different from the DevTools Performance panel?

The Performance panel gives you the raw picture and leaves the joining up to you. If you know what you are looking for it is excellent, and I still open it most weeks. Perflex does the joining up: it puts long tasks, network, layout shifts and memory on one timeline, works out the cost per script and per function, checks the result against 37 known problems, and gives you a sorted list with a fix attached to each one.

02

How does it work out which function?

Chrome's Long Animation Frames API reports scripts that blocked a frame, along with where they came from. Perflex takes those entries, hashes the stacks with FNV-1a, and adds them up per script and per function inside the correlator worker. That is what turns a long task into a named function at a known position.

03

Does profiling slow the page down?

A bit, unavoidably, so Perflex measures how much. It watches its own cost against the frame budget and throttles itself if it passes 2%. The heavy work, meaning the correlation, the checks and the Lighthouse estimate, runs in workers rather than on the main thread, so it does not end up in the numbers it is producing.

The experimental collectors are off by default for the same reason.

04

What leaves my machine?

By default, nothing at all. No account, no telemetry, no server. Sessions live in the tab and are cleared when you navigate away.

The exception is the AI features, which do nothing until you add your own Claude or Gemini key. When you use them, what goes out is a summary with the identifying parts taken out: file names, function names and numbers. URLs are cut back to site.com/path. Request bodies and page content are never included. Permalinks are local too, since the session goes in the part of the URL after the hash, which browsers do not send to servers.

05

Which browsers does it work in?

Chrome, Edge, Brave, Arc and the other Chromium browsers. It is a Manifest V3 extension. On Arc the dashboard opens in its own window, because Arc does not support the side panel API yet.

06

Do I need an API key?

No. Everything that matters works without one, and without any network access at all: the attribution, the script list, the timeline, all 37 checks, the written fixes with their code, the Lighthouse estimate, the waterfall and every export.

A key only adds the chat tab and the per-problem AI answers. Gemini's free tier covers it if you would rather not pay for one.

07

How do I share a session with someone?

Two ways, both offline. Copy permalink puts the whole session into the part of the URL after the hash and points it at a static viewer, so the person you send it to decodes it in their own browser and nothing is uploaded on the way. Download shareable HTML gives you one file that opens in any browser with no extension and no server, which is the one to attach to a ticket.

There is also a PDF with the gauges, the vitals, a small waterfall, the worst interaction and the code, for when somebody wants a document.

Built with

Manifest V3 · TypeScript (strict) · React 18 · Vite + CRXJS · Zustand · Web Workers · D3 · @tanstack/react-virtual · Tailwind CSS · Vitest · Claude API · Google Gemini API